Predicting tubing trip times with current speed data
A statistical model that's just the thing for a better trip with your friends
Capture the utility of using statistical models in your life with this simple method of modeling tubing trip lengths from government water current data. This is a story you’ll return to when people ask you what can statistics be used for!
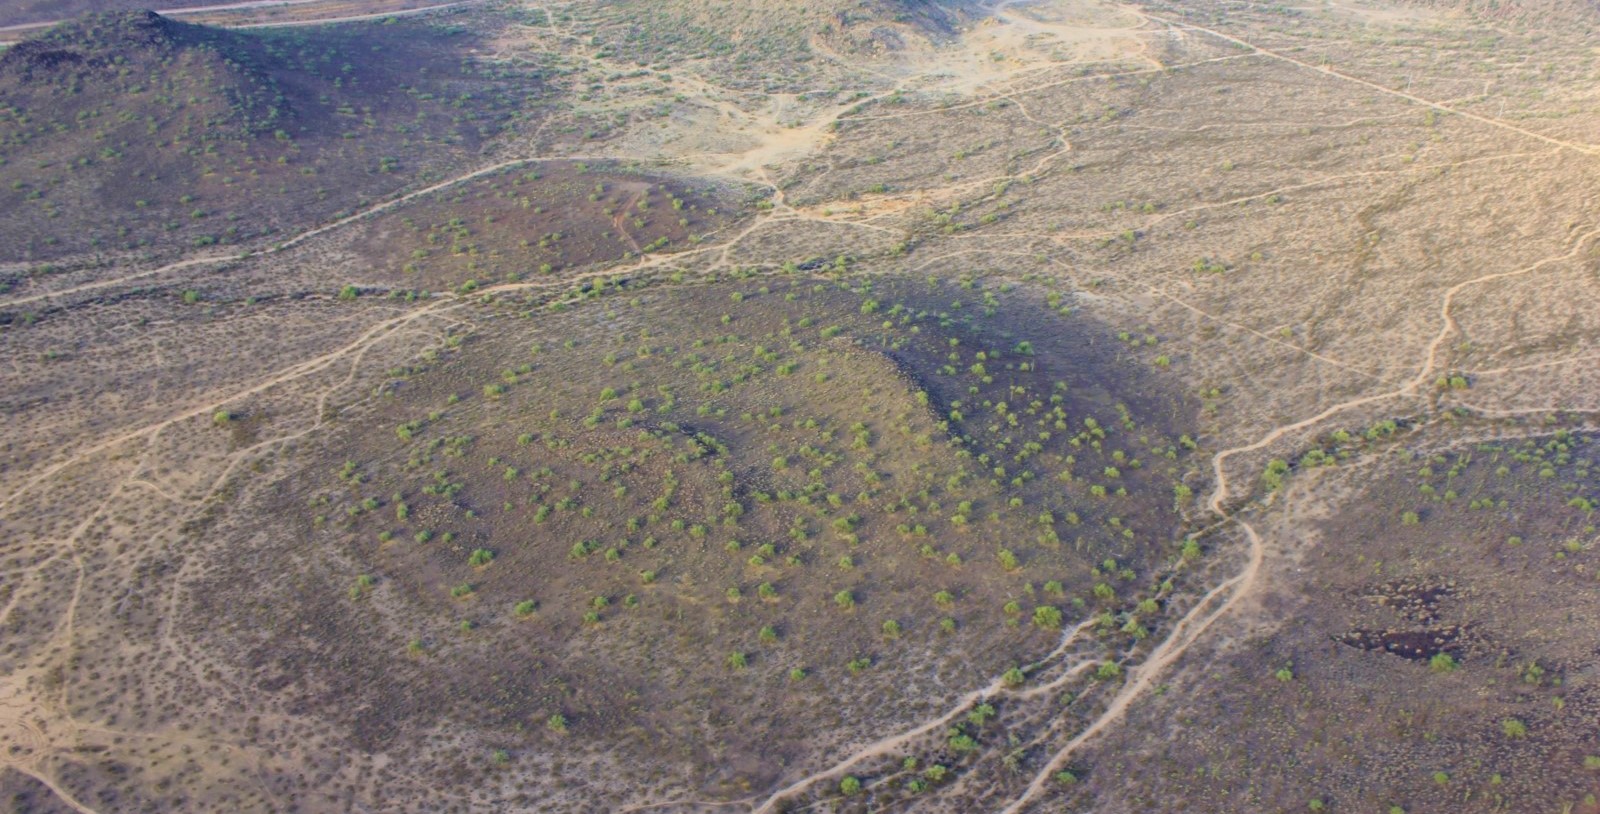
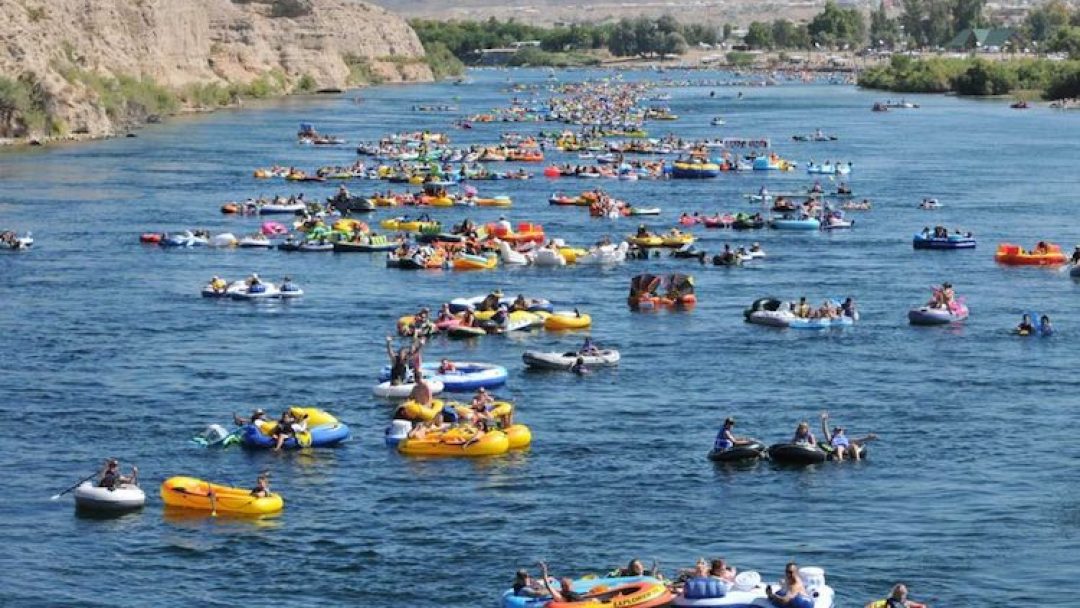 (source: AZ central)
It was the hot Arizona April of 2014, and I was in the twilight weeks of a PhD program. I had just successfully defended my disseration and was putting the final touches on it, but having already started a new full time job I was in a stressful point of transition in my life. But one light shined brightly in my future–my favorite activity in Phoenix was going lazy-river tubing in the Salt River and it was about to be the start of the tubing season.
For those of you unaware, tubing is the classic American activity of sitting in a flimsy inflatable tube as the current of a river pulls you through a scenic vista. Next to you, of course, is often a second tube with a cooler of alcoholic beverages. The American way. And since this was right next to Arizona State University, it was a favorite pastime of undergraduate and graduate students alike. You were just as likely to float by a wild horse running alongside the river as you were to see a 19 year old light a joint. It was strangely relaxing.
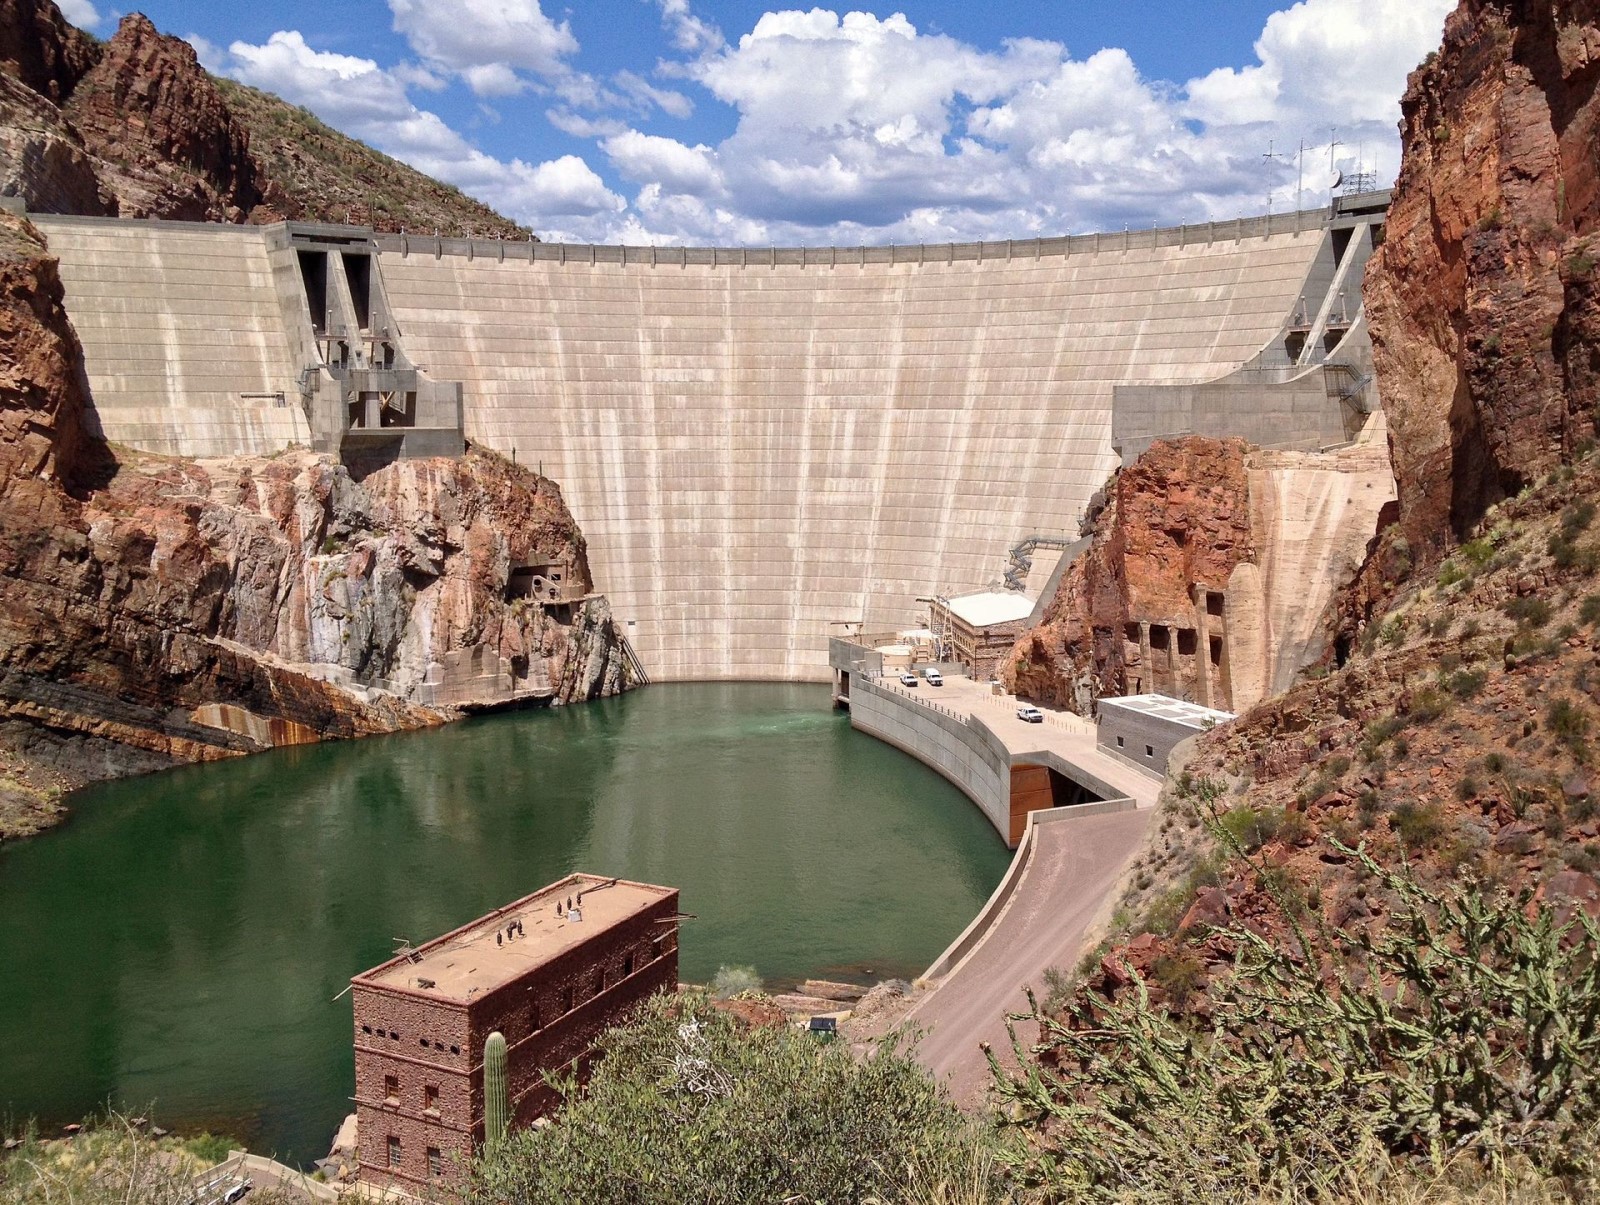 (Source: Nicholas Hartmann - Own work, CC BY-SA 4.0)
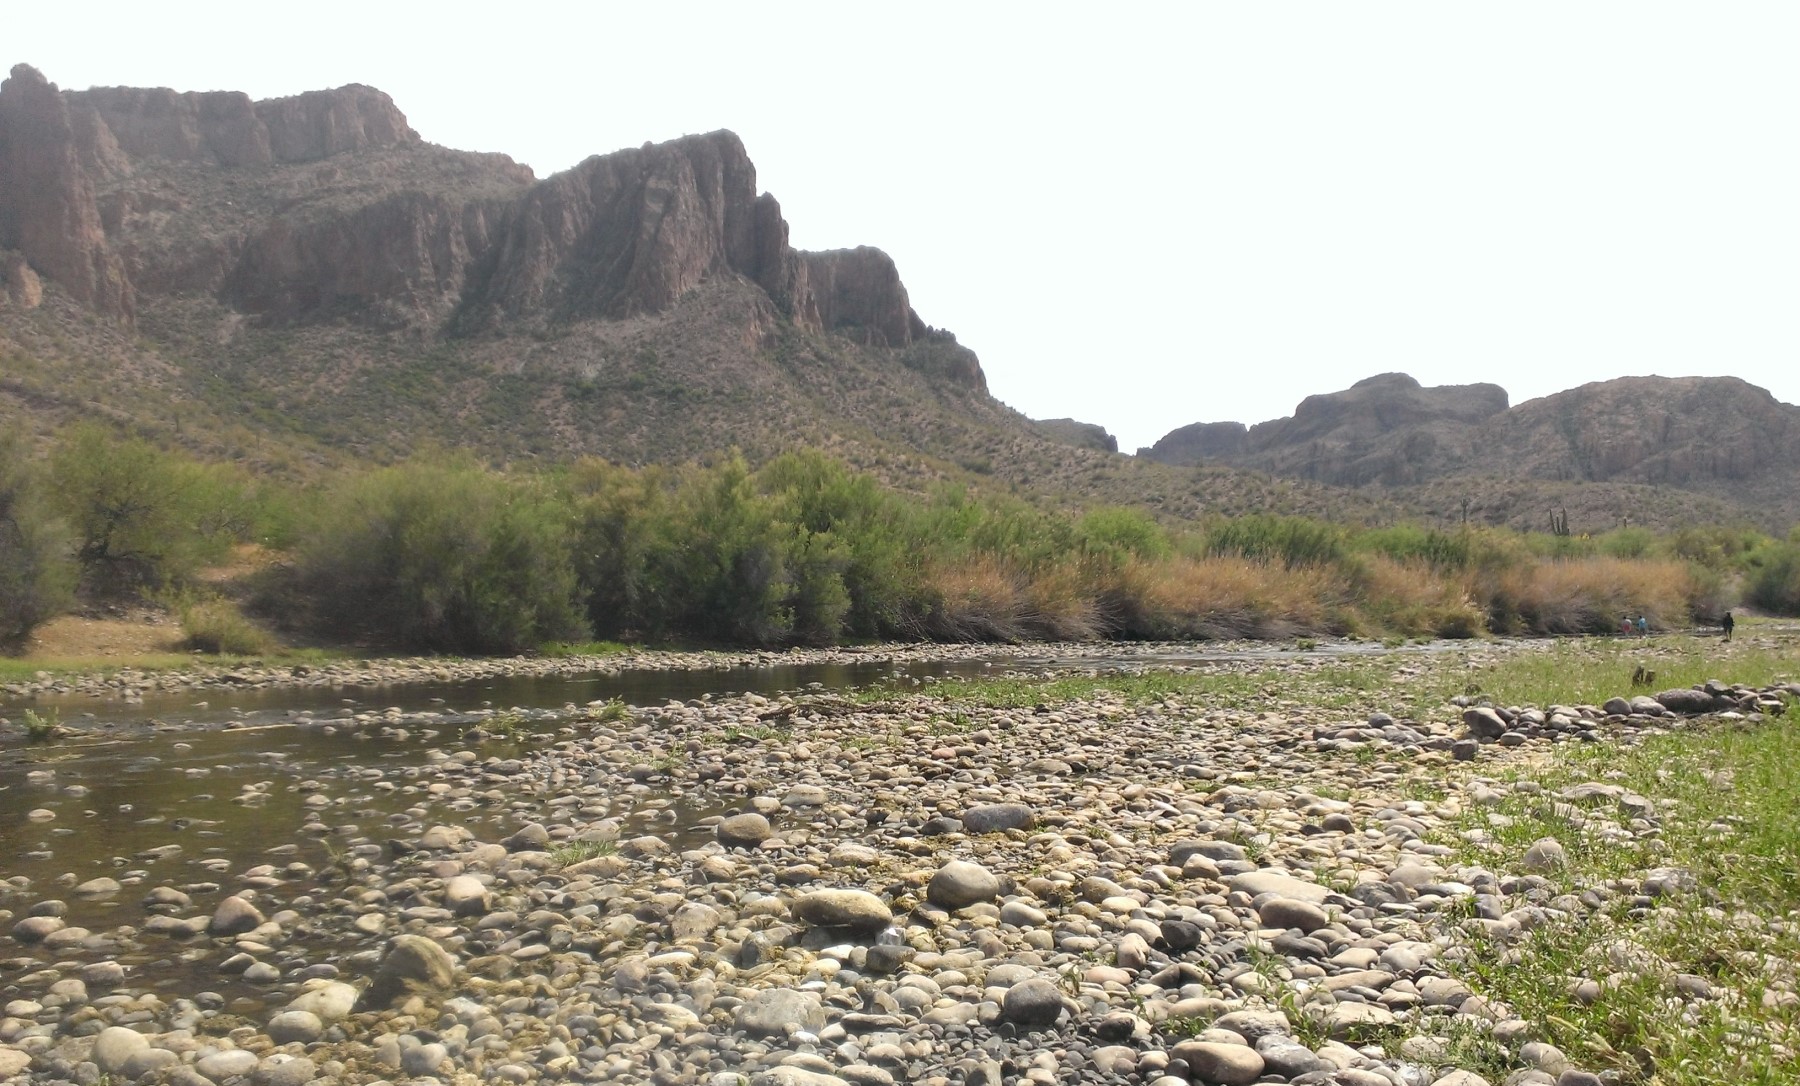
However in this particular April tubing posed a problem. The Salt River watershed has a dam right in the middle of it, and the amount the dam is opened changed how much water flowed in the river. The perfect calendar weekend for me and my friends to take a trip was approaching, but the dam wasn’t open! The big government kept it closed in the winter which meant there was no river for us to tube on whatsoever. It was just a bunch of rocks where a river should be. Tragic. I was able to tell because a US government website reported the rate of discharge of water from the dam which updated every fifteen minutes, and that website was showing straight zeros.
As was approached three days before the scheduled weekend to go tubing, the website changed to show that the dam had opened and water was starting to flow. The rate of flow was an extremely low 200 feet per second flow, but hey it was above zero which should mean there was water to go tubing. So that Saturday me and nine of my friends headed out our inflatable tubes to get on the river and relax.
When we arrived we were thrilled to see a real river in front of us. Our tubes splashed on the water and we hopped in–it was so early in the season there was no one else there and we had the river to ourselves. But in seconds we could see there was a problem. There was a river indeed, however it was flowing tragically slowly. We then had a choice to make–to we let the river take us downstream to where we parked the pickup car, knowing it would take far longer than expected with the slow current? Or to we bail out and miss a fun time? As graduate students, we had no choice but to commit to fun. In other times that we had gone tubing the trip would be around two hours. How long could this be?
By hour four we were in crisis mode. The temperature was over 100 degrees and the sun was beaming down on us, we were clearly sunburned and dehydrated. We were also all very inebriated–with spending so long on the river we didn’t have much else to do but drink, which was normally fine but here became too much. We also were able to tell we were exactly halfway between the starting point where we parked two cars and the ending point where we parked another. And it was the middle of the desert.
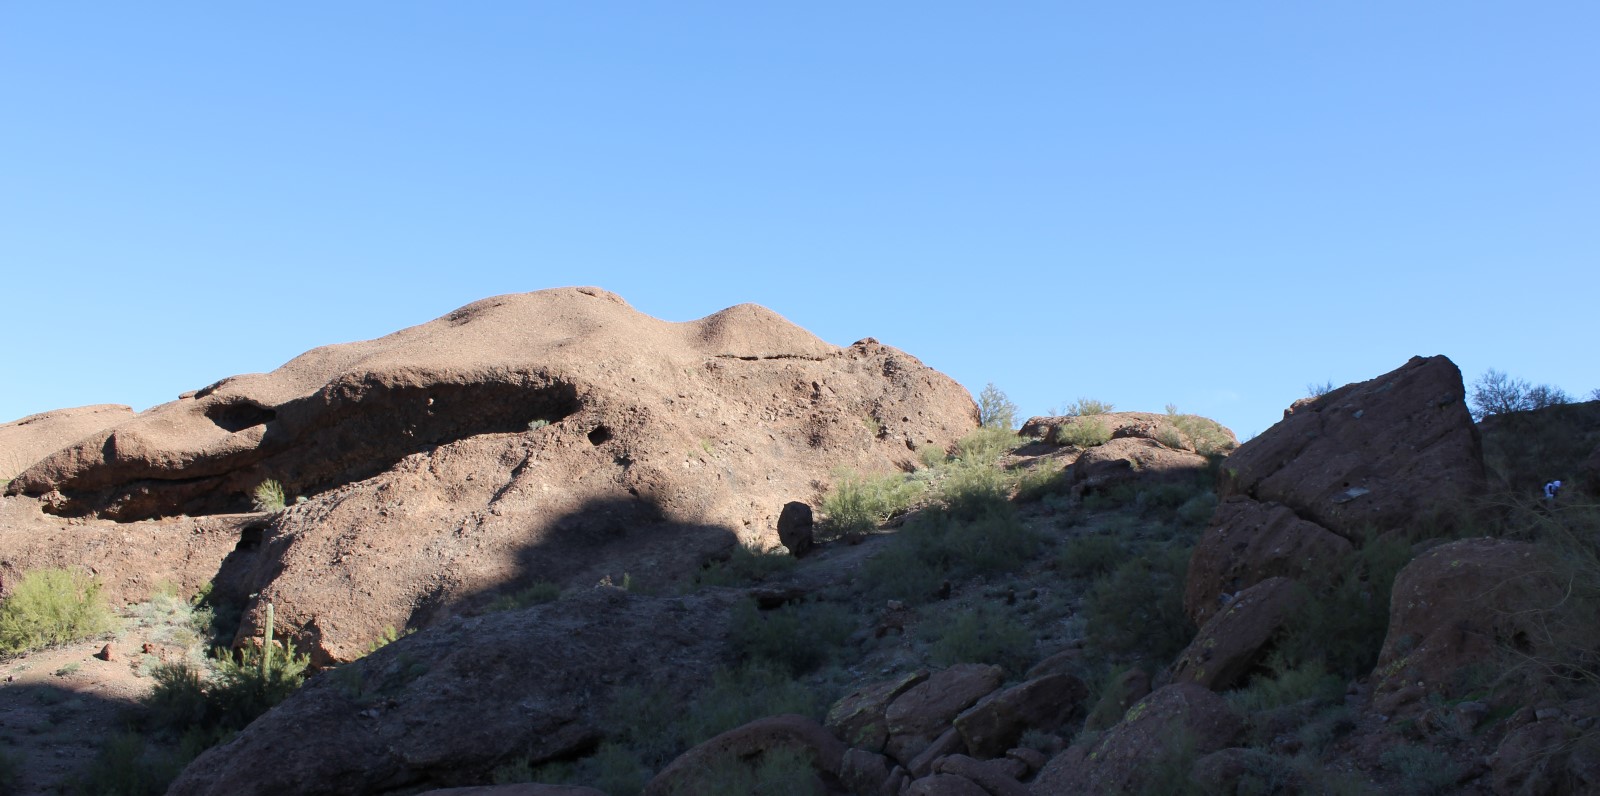
Tragically, we chose perhaps the worst way to tackle this problem–we split up. Some people stayed on the river hoping to get to the end. Some got to the side of the river to walk back to the beginning, and some wandered into the middle of the desert hoping to find the road. I was in that last group.
Wandering in the desert with nothing but a cooler of beer and a hope for a road to hitchhike on is quite scary. Doubly so in the middle of the hot afternoon Arizona sun. Thankfully we did find a car to hitchhike in, and by hour six the entire friend group had reassembled and got into our cars to drive home. No one was happy.
But that night I realized, the best way to avoid a situation like that was a statistical model. Perhaps I could create a model that would take as input the real-time flow data from the government website, and use that to create a prediction for how long the trip down the river in a tube would take. This would allow me to better plan my day when going tubing, and avoid situations where a slow current strands me. The perfect place for statistics.
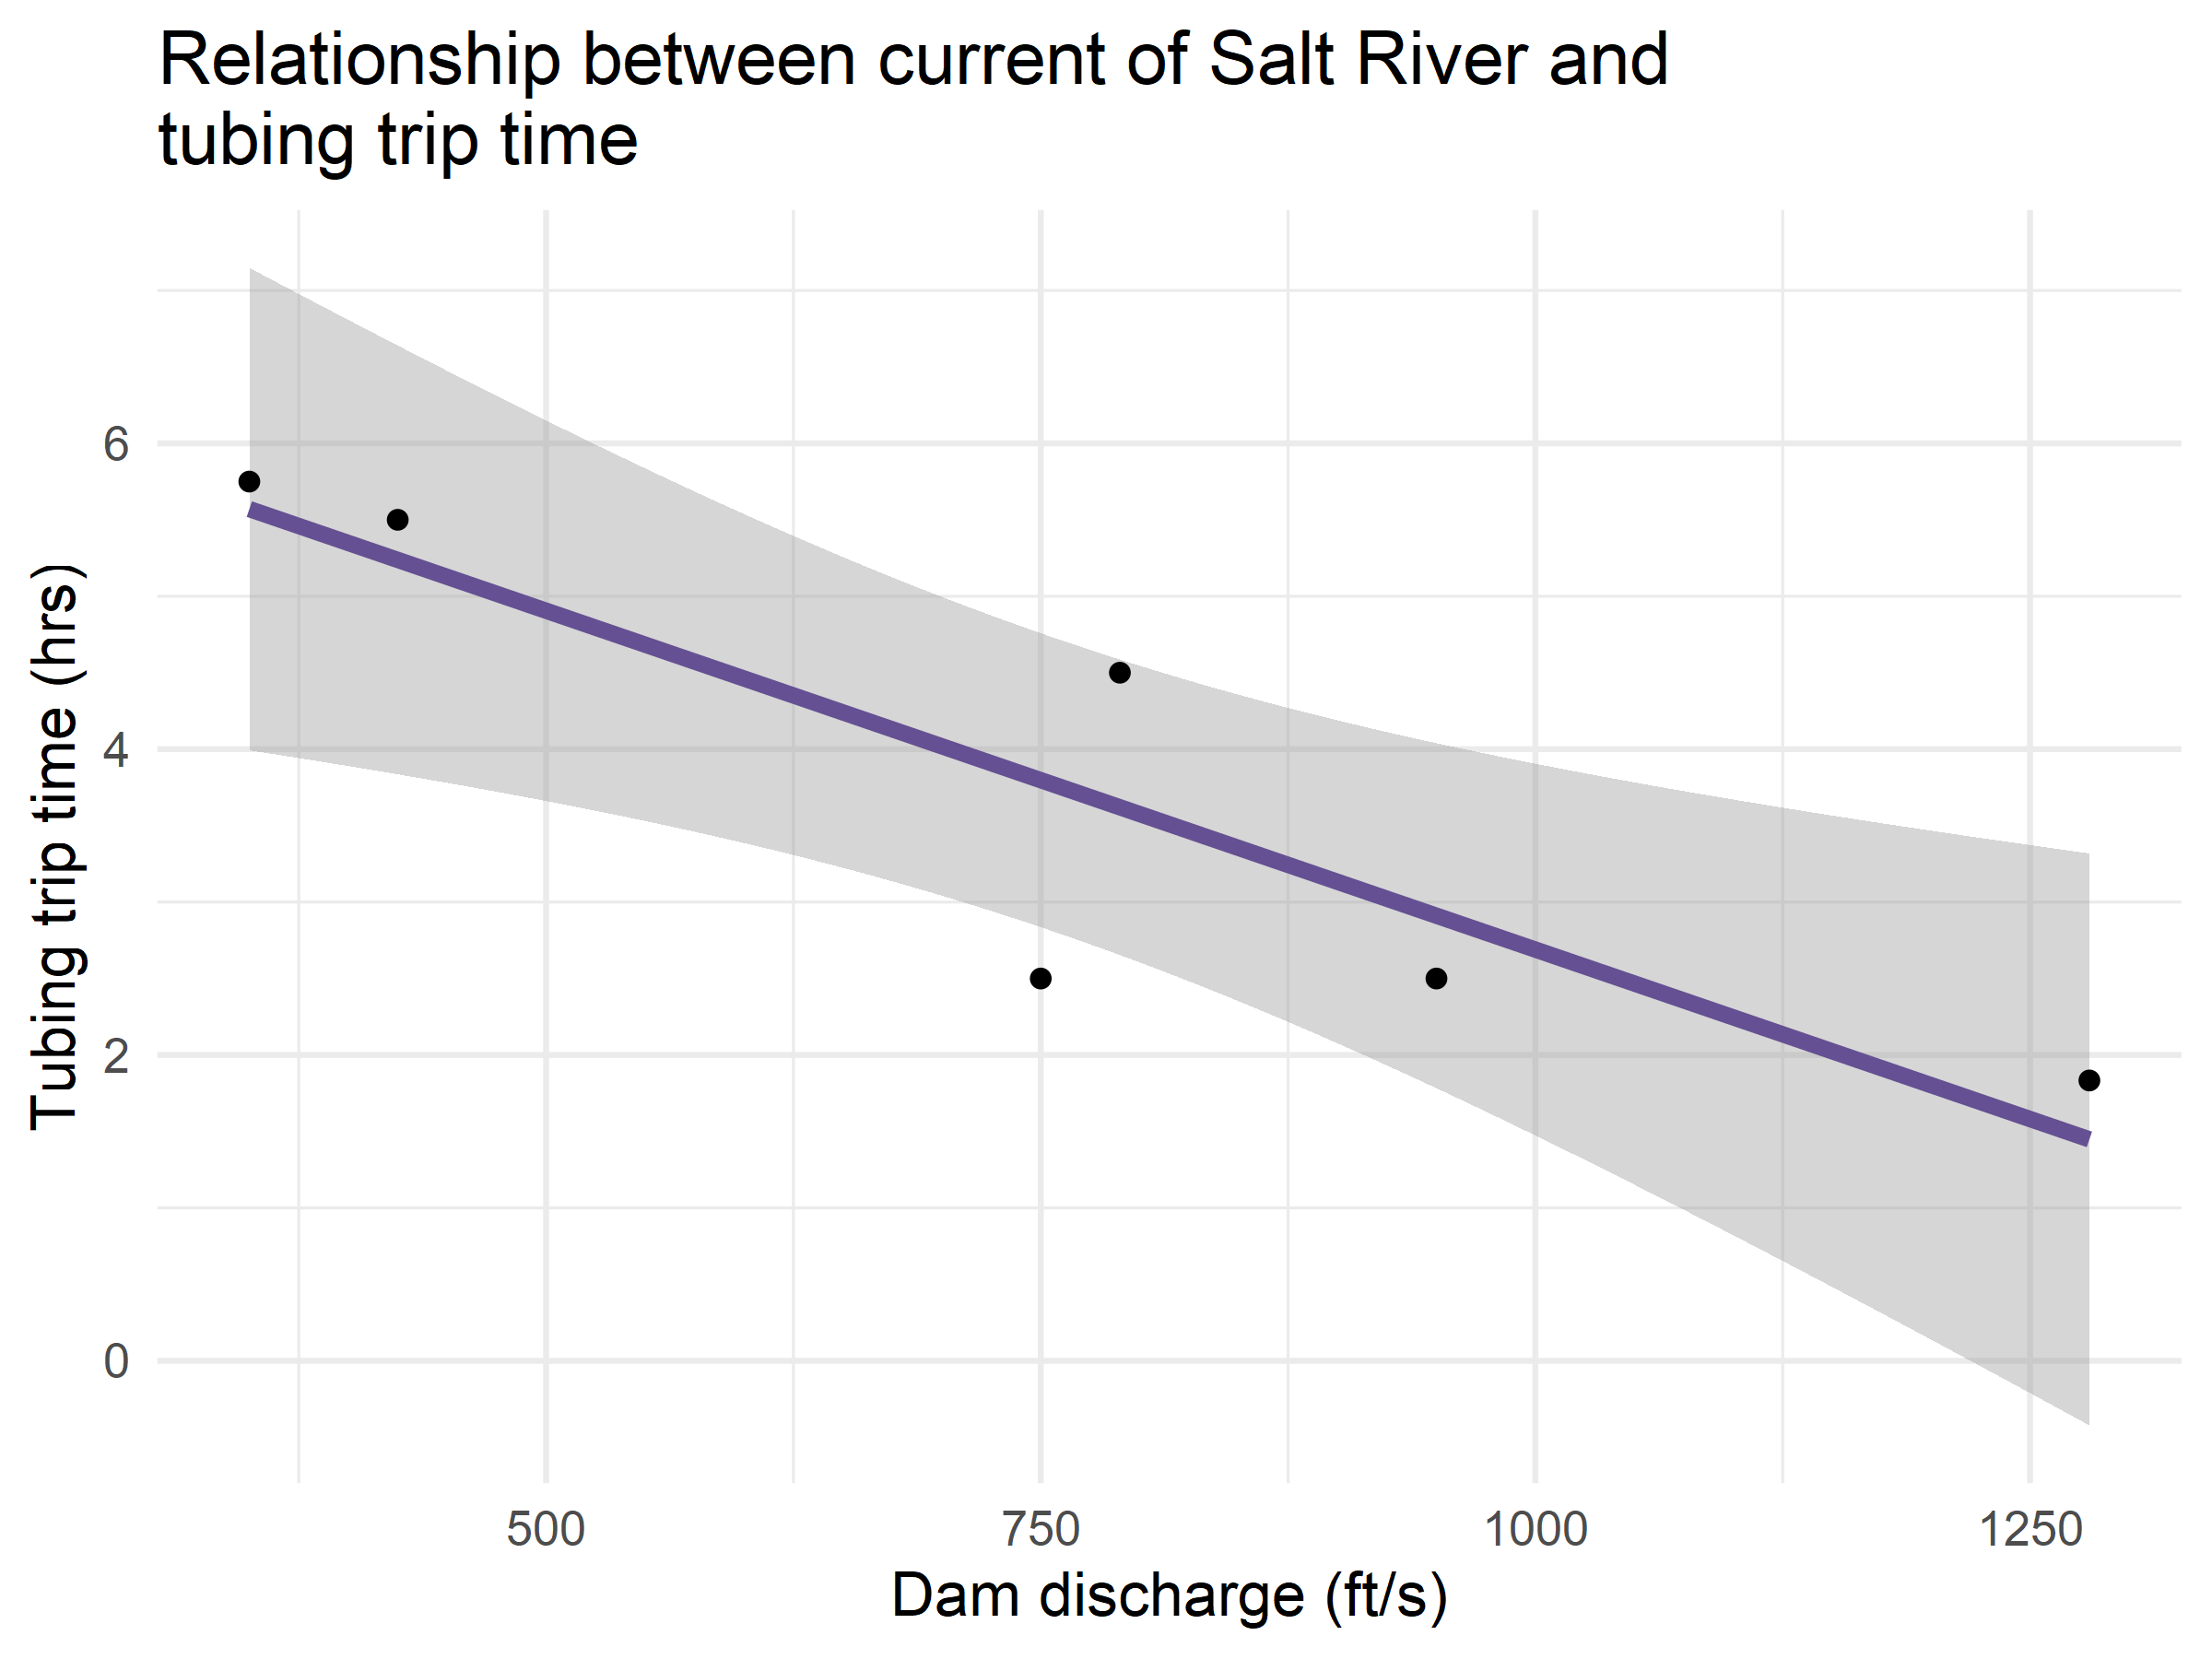
The amount of time it takes to flow down the river should be modeled using a simple flow equation from physics–the rate that the water is flowing through the dam should be inversely proportional. The difficult was it was hard to know the exact relationship without knowing things like the width of the river. Thankfully trying to model the exact physics could be avoided by collecting datapoints from tubing down the river to fit a model to. If every time my friends and I went tubing I logged both the time it took to go down the river, and what the waterspeed was at the time we started tubing, I could fit a one parameter linear model to the waterspeed that predicted the number of hours the tubing trip would take.
So the following summer of 2014 I did that very thing. My friends and I went tubing six times, and each time I took a log of who was on the trip, what time we started and ended at, and what the reported waterspeed was. I then took those datapoints and put them in R, and was surprised to see just how clear the relationship between waterspeed and the trip length was.
| Date | Dam discharge (ft/s) | Start time | End time |
|---|---|---|---|
| 2014-04-19 | 350 | 12:45 | 18:30 |
| 2014-05-04 | 425 | 13:00 | 18:30 |
| 2014-05-25 | 750 | 12:00 | 14:30 |
| 2014-05-30 | 790 | 10:45 | 15:15 |
| 2014-06-12 | 1,280 | 10:20 | 12:10 |
| 2014-06-29 | 950 | 10:15 | 12:45 |
I was amazed to see just how much the waterspeed correctly predicted the trip time–I figured with things like different amounts of people on the trip or different amounts of relaxing during it, there should be more variance than what I saw. It turns out really the one thing that matters for how long a trip will be is just how fast the water is going. And the model correctled predicted that the fateful trip would have been well over six hours.
With this model in hand, never again did I find myself stranded in the desert due to a poorly planned tubing experience. I was safe thanks to the power of statistics and R. If you find yourself stranded in a hot desert surrounding the Salt River in Arizona, I hope this statistical model might be useful to you. This little joy of a model really inspired me, both in terms of helping me navigate the rigors of planning a tubing trip, and showing me that statistical models can be used everywhere.
Jacqueline’s Statistical Model for Tubing on the Arizona Salt River Recipe
Ingredients
- Records of how long tubing trips have taken your friends over the course of a summer
- Salt River current data from the US Geological Survey
- The R statistical programming language (substitute Python if unavailable)
Instructions
- Create csv file of tubing records that has a row for each time you went tubing and a column for the time in hours of the trip and the current of the river when you started tubing
- Load the csv file into R and store as a data.frame or tibble
- Plot the data using ggplot2() with a geom_point(), then fit with a geom_smooth(method=“lm”), using the lm method to fit a line to the data.
- Theme the plot to taste, then serve in a RMarkdown file or Jupyter Notebook if using Python