Using data science to analyze my data science book
An extremely meta analysis of the book Build a Career in Data Science
With the publication of the book Build a Career in Data Science by me and Emily Robinson, I couldn’t wait to use some of the techniques from the book on the book itself. Build a Career in Data Science covers all the non-technical skills you need to know to become a data scientist - from making a great resume to managing stakeholders. There is a great method covered in an entire chapter of the book (chapter 4) to help you get into data science, keep your skills, strong, and make you more marketable for future jobs: building a portfolio of data science projects. So in a true ouroboros of a blog post, I will do a side project where the dataset I’m analyzing is each change to the book itself as we’ve written it.
So let’s get cracking on the project! Thankfully, chapter 10 of the book is all about how to make an analysis. I used a technique from that chapter and created an analysis plan before I started doing any data science. When working on data science projects it’s very easy to lose focus on what your goal is and pursue whatever part of the data is most interesting to you in the moment. Having a plan makes you less likely to waste time on approaches that don’t pan out. Here is the analysis plan from when I started the project:
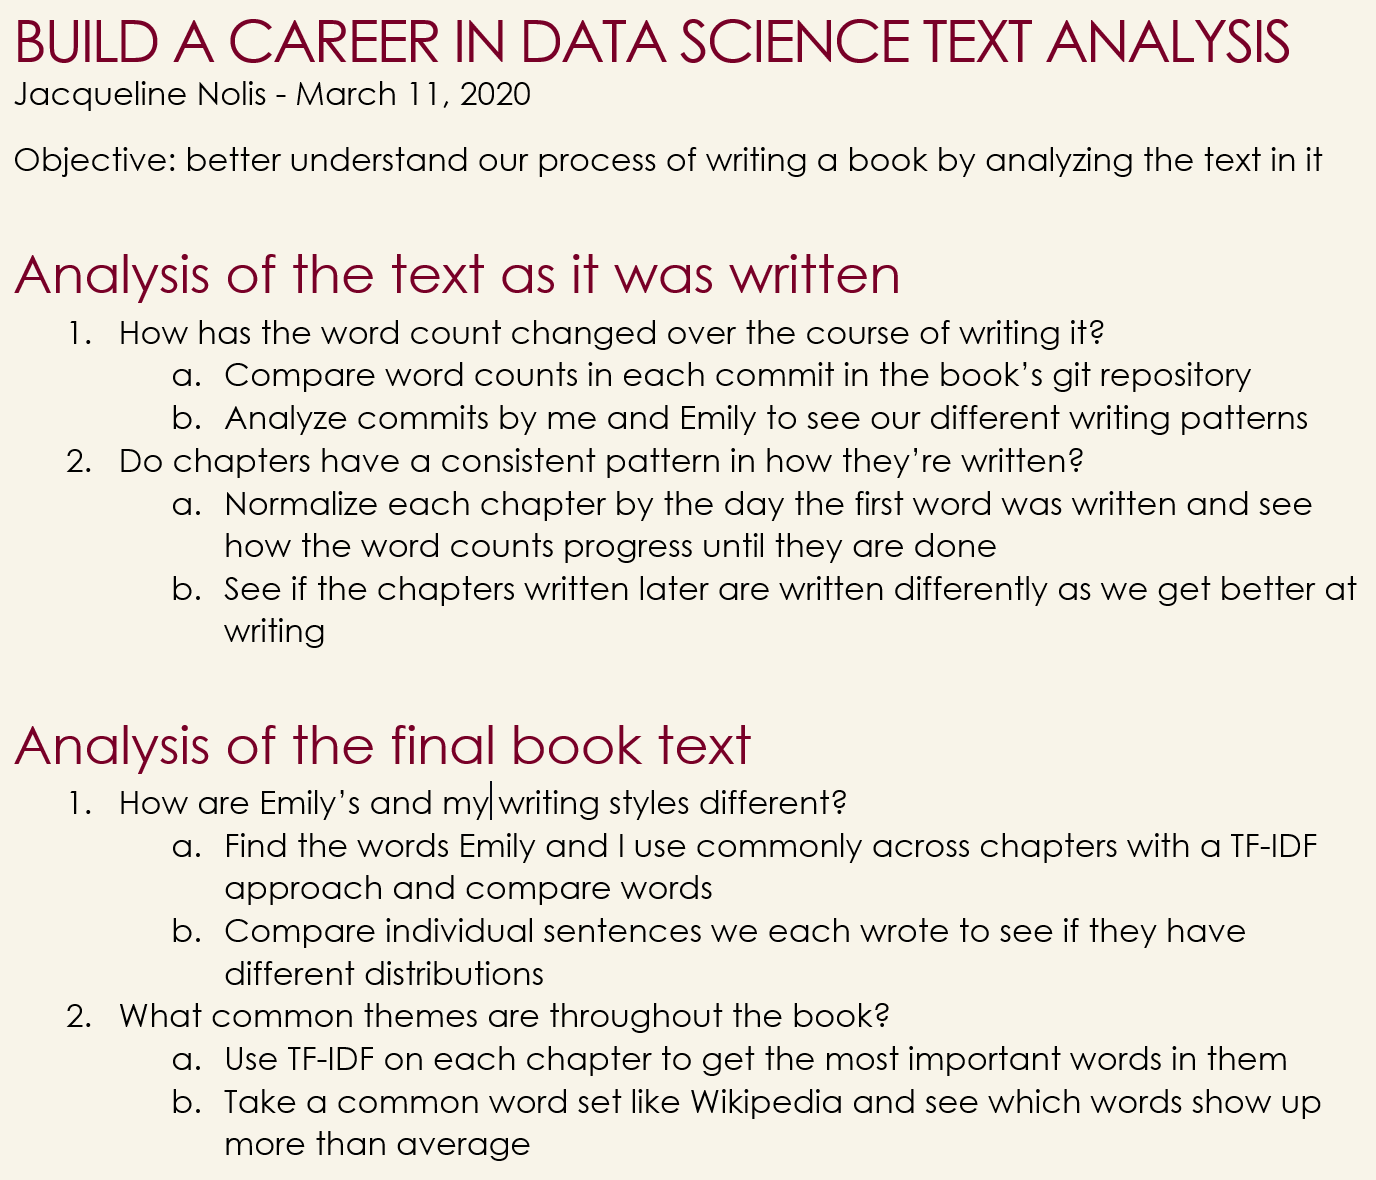
My analysis plan at the start of analyzing the data. Spoiler alert: the first half took way longer than expected so I didn’t do the second part.
Gathering the data
The documents containing the manuscript itself were in our GitHub repository, and they included one document per chapter plus a bunch of documents for things like the acknowledgments and appendix full of interview questions. For the analysis I chose to use the programming language R, because I love R. That being said the material in the book itself is language agnostic. I needed to write code that would turn the repository into an R data frame that contains the text at each commit at the time of writing it:
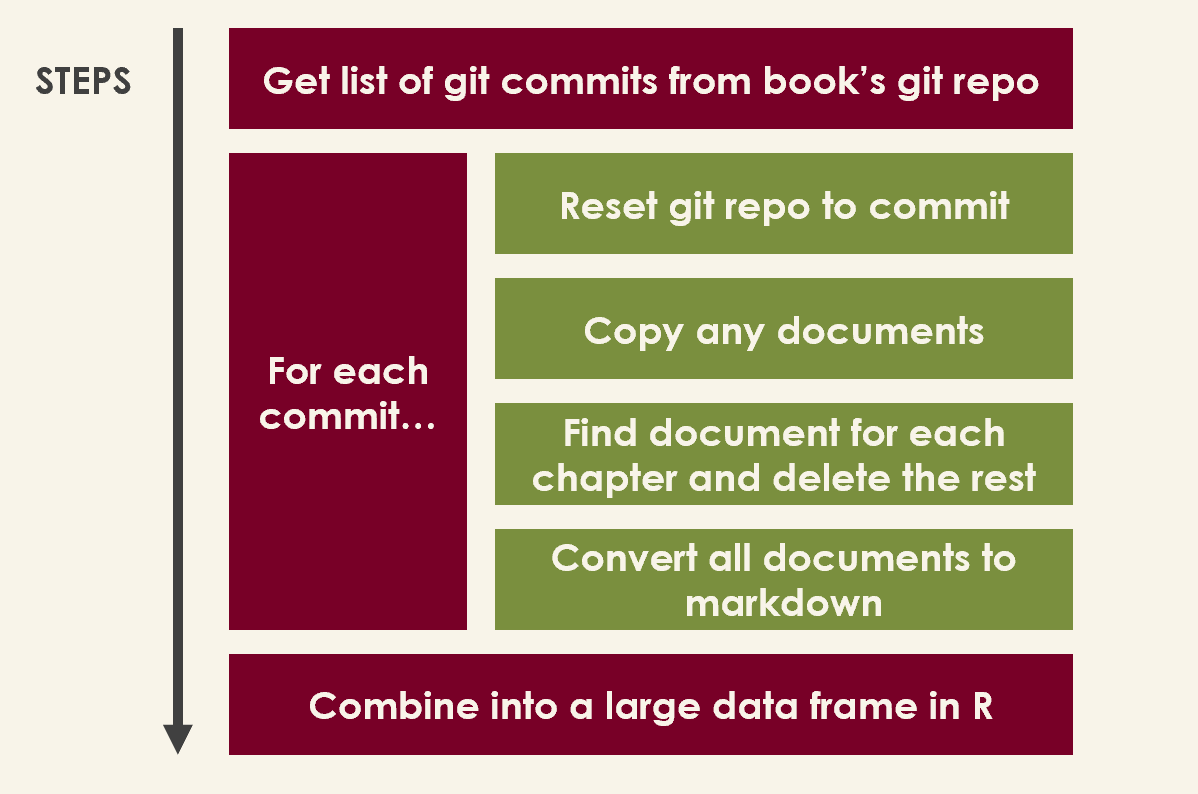 Steps for creating and cleaning the dataset.
While I ultimately was able to collect all the data, it took my waaaay longer than I expected it to. Some of the many problems I had to deal with were:
-
The way we stored the manuscript changed over time. In the beginning we would name chapters things like
ch07_the_interview.mdwith an abbreviation of the chapter name in the file. That later switched toch07_build_career.docx. Not only did the file names change to “build_career” to fit the publisher’s specifications, but we had to switch from markdown documents to word documents because apparently when you’re writing a book the “publisher” cares about “format and styling” so we needed to use their template. -
We broke our own standards all the time. If a document should have been named
ch07_build_career.docx, we as fallible humans would occasionally do things likech07-build-career.docxand catching all the mistakes when reading the data in was hard. -
We stored files with our manuscript that made our data weird. In the book we talk about *weird *data as data that was totally implausible that indicated something was wrong, such as data showing an airplane landed before it took off. When collecting this book data I would occasionally see implausible values, and it would turn out to be things like accidentally including an entire 1 hour transcript of an interview we did into the text. This took work to clean up.
This problem of having the data collection take longer than you expect is something we cover in the book too. It’s totally natural and normal for data to be messy since it’s usually created in messy ways. As a data scientist, it’s your job to accept what you’ve been given and do the best with it. If you can find ways to improve the data collection process and make the data come cleaner that’s great, but don’t avoid doing work just because you have to spend more time on the setup than you’d like.
The findings
Here are three findings from the analysis that I thought were worth sharing. They were all made using only R and a few packages such as tidyverse and lubridate.
Book length over time
Here is a plot showing how the word count grew over time, colored by which author made that commit:
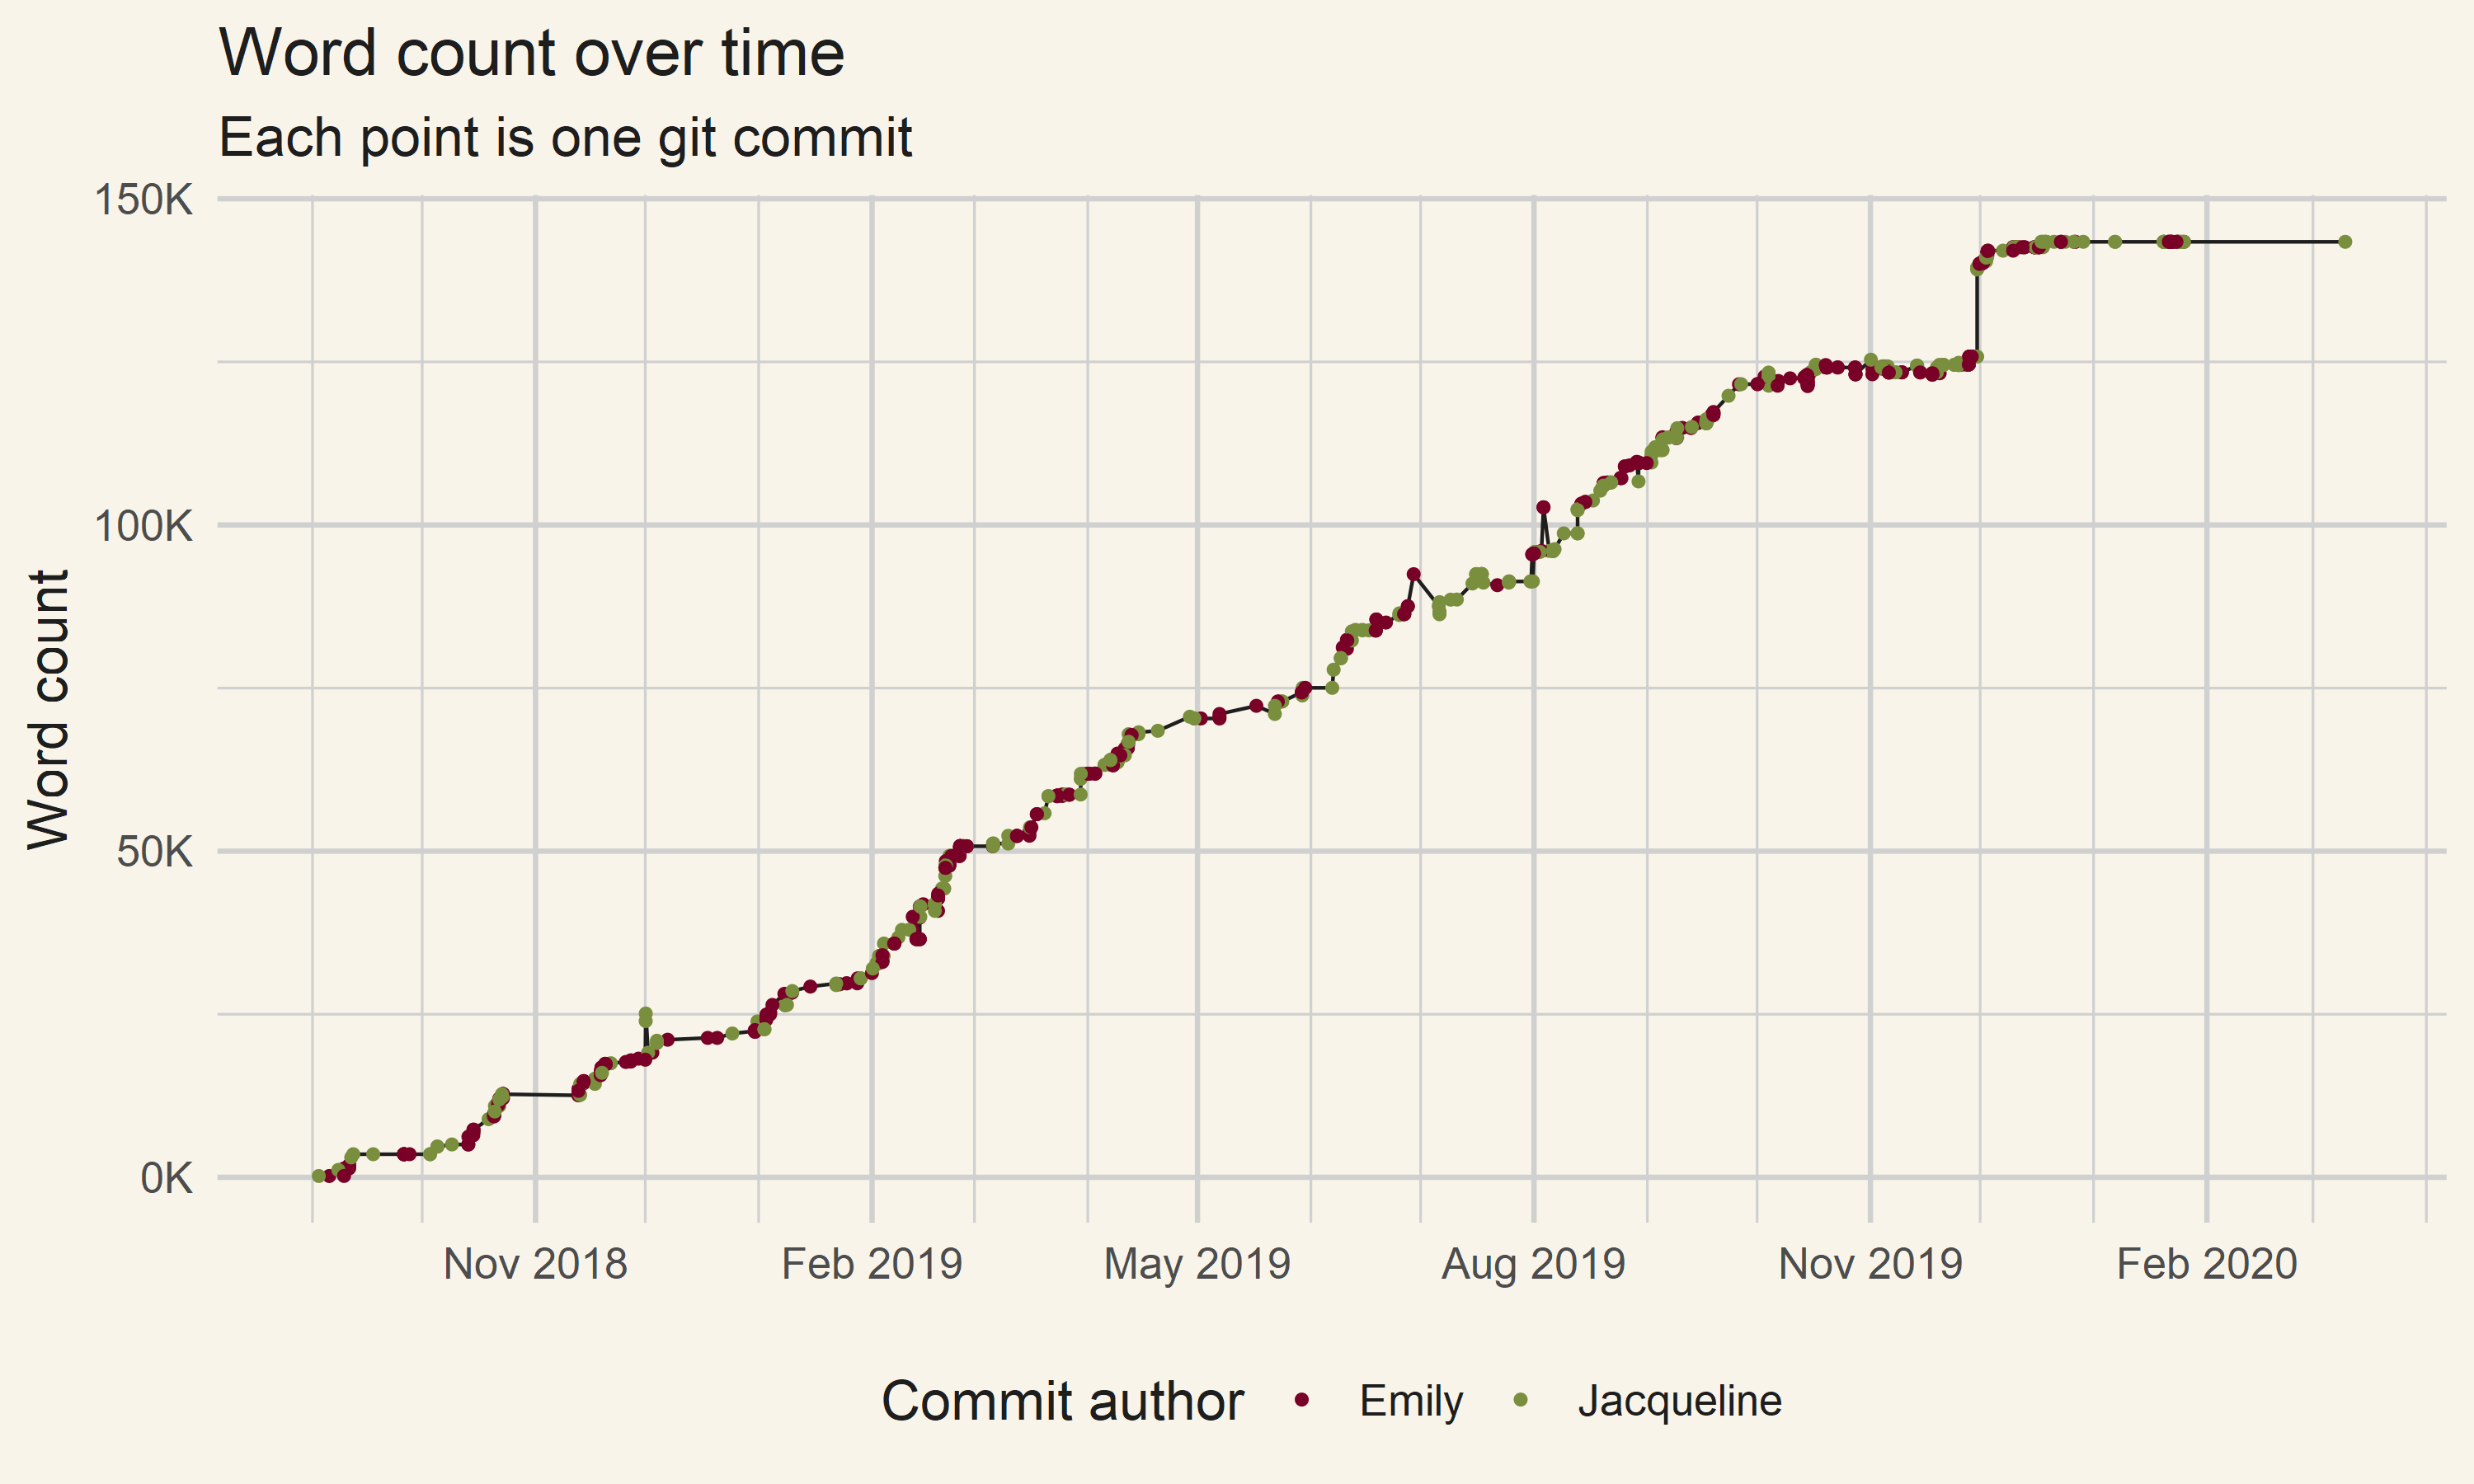 The word count of our book over the 19 months it took to write it.
When you look at the word count a couple things pop out right away. Overall, it seems like the writing went at a fairly consistent rate. It looks like we wrote somewhere around 50k words every three months. Both Emily and I wrote fairly consistently throughout the process with a couple of times where only one of us wrote. There are a few gaps in the writing, such as November 2018 or May 2019, and those were usually us waiting for feedback from the publisher before continuing. There was a strange jump in words December 2019—that was us adding the end matter to the book (with interview questions and suggested resources) from its previously draft state. We didn’t just 15k words in one day.
Looking at this graph I think we can learn two things about the writing process. First, it really works by you chipping away at it over time. Having a few all nighters isn’t a great way to write a 350 page book. Second, having some points in the writing where things go slower isn’t a death sentence. If you need to wait two weeks for the publisher to get back to you or take a two week vacation your book can probably survive it.
Chapter growth
Here is that same data from before, but now the chapters are split to individual charts.
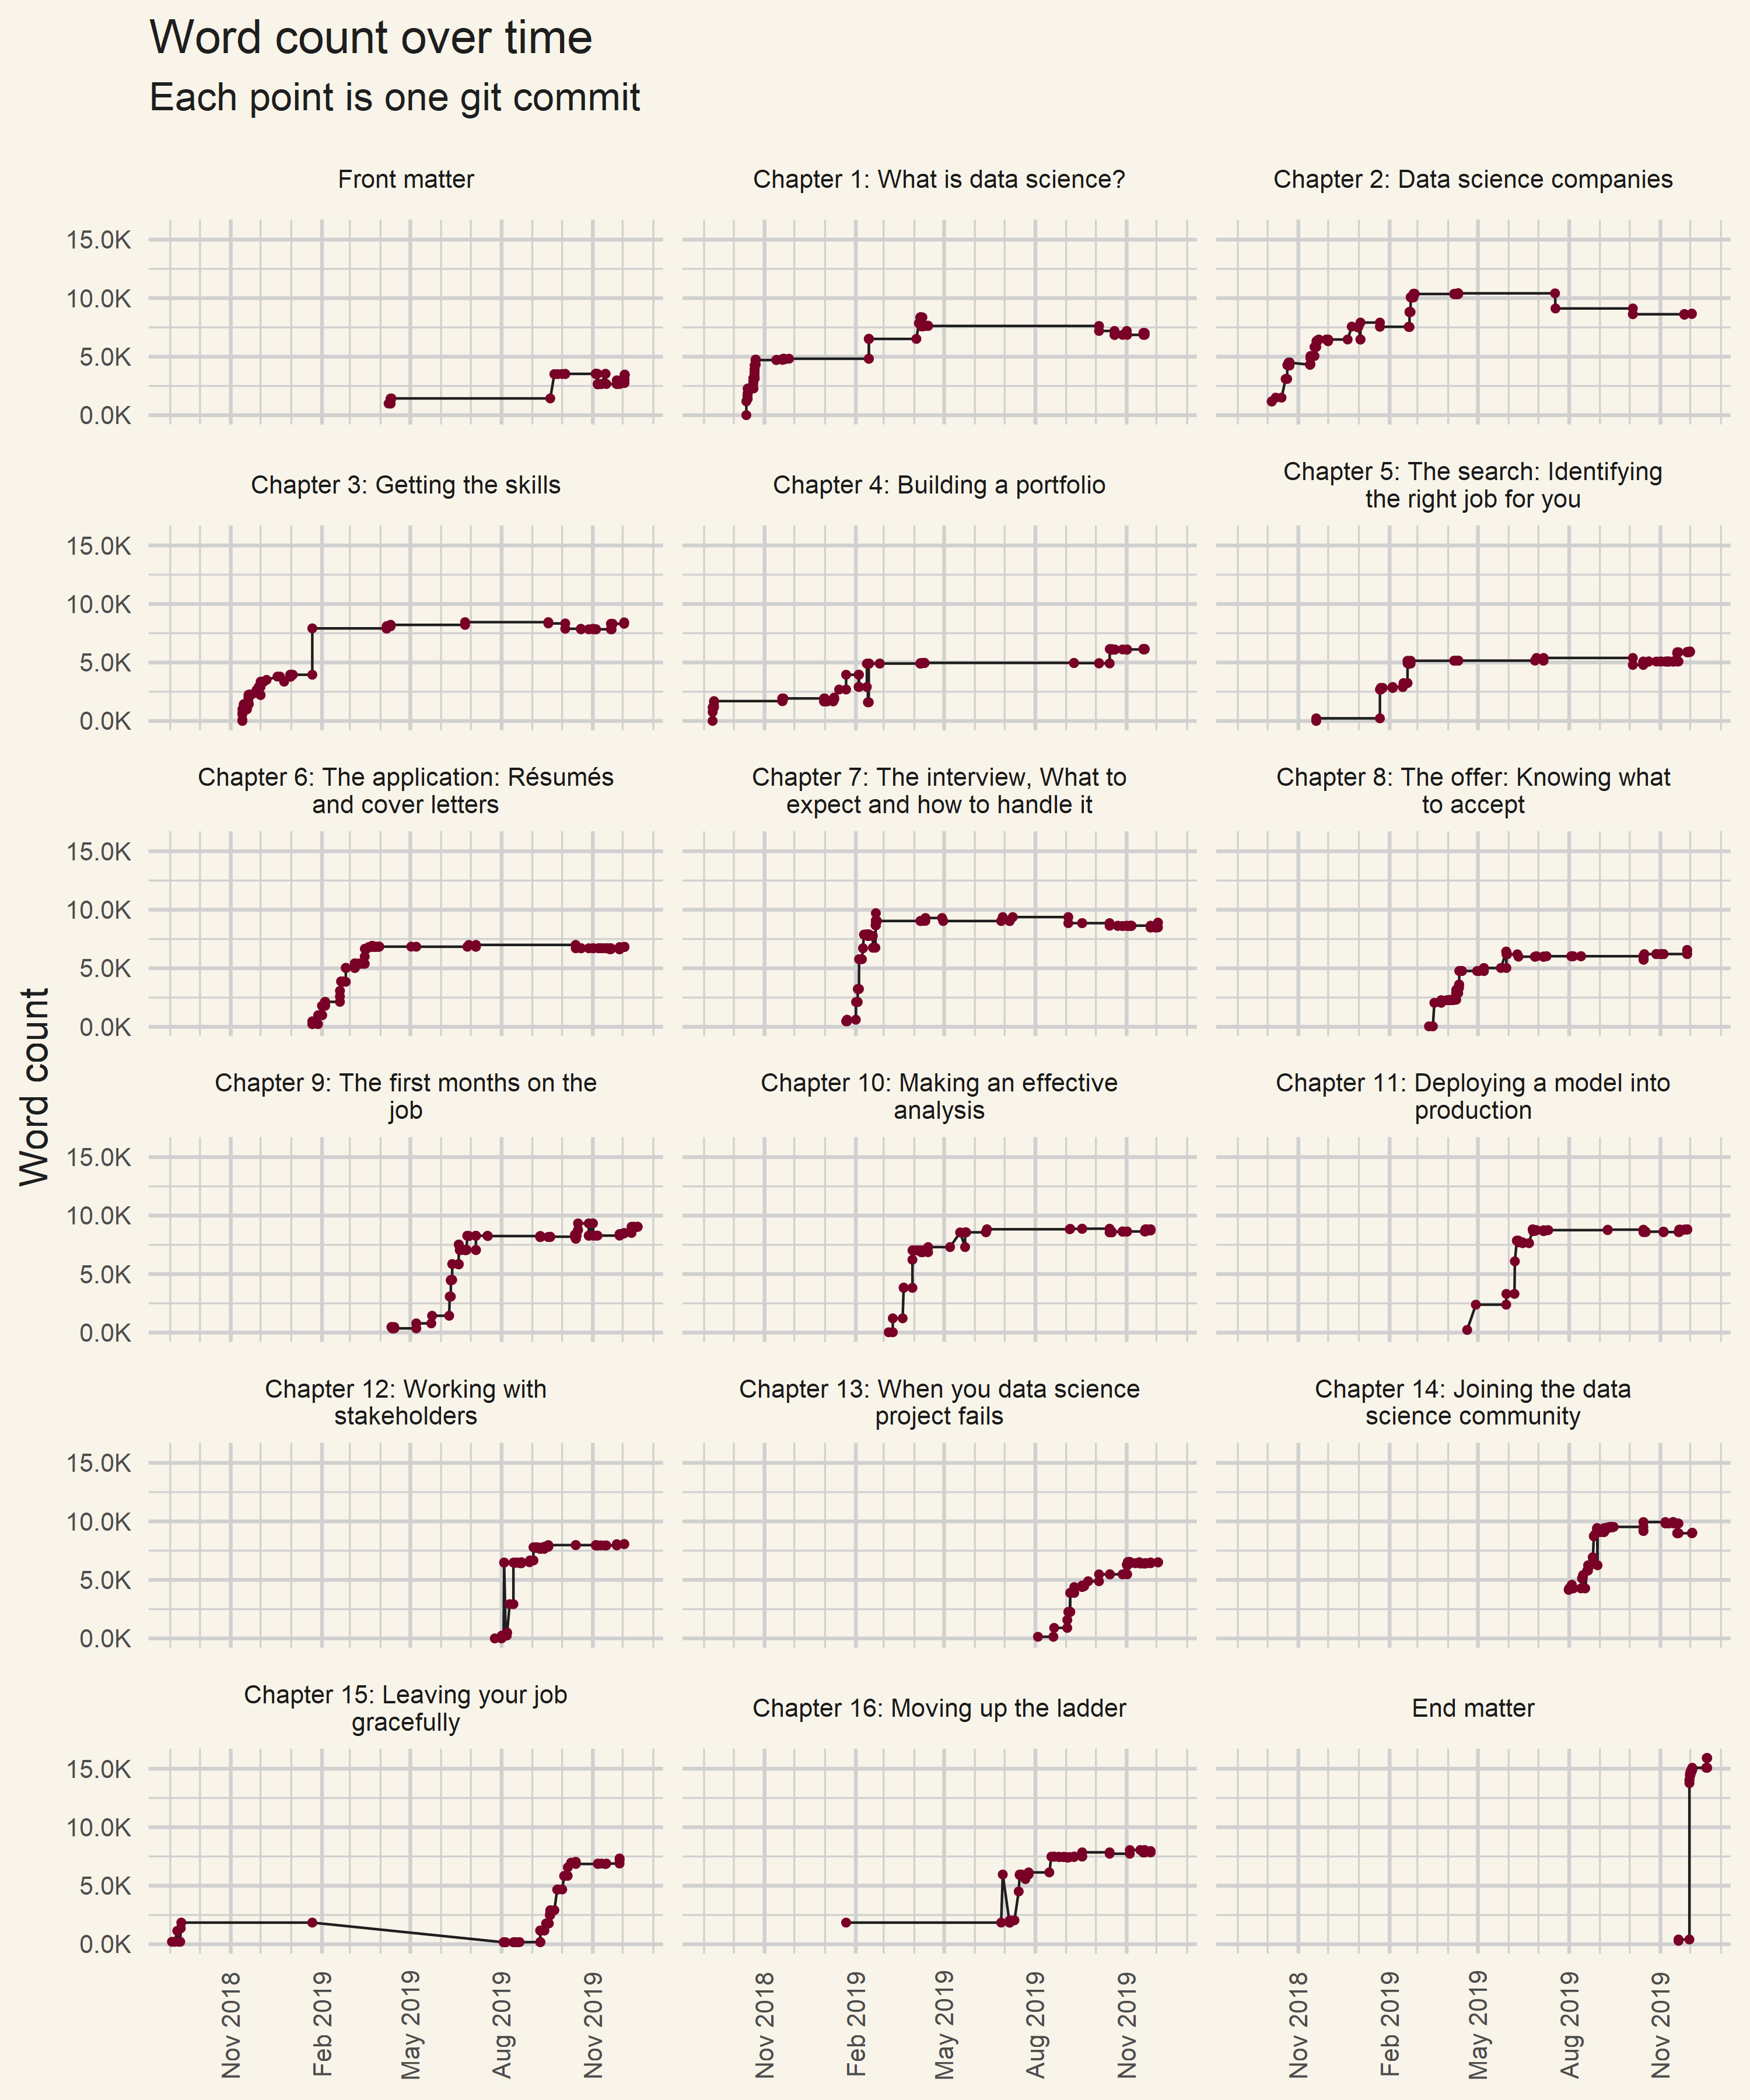 Progression of the chapter writing
Most of the chapters, such as chapters 6ΓÇô14, have one or two core weeks where they are mostly written and then edits are made until the book is published. A few chapters, like chapters 2 and 3, have a more gradual build up as they get added to over time. These chapters took a couple of takes to get right during the writing process. Almost all of the chapters have a single commit that adds a lot of words near the end: that’s from us adding an interview with an interesting data scientist to the end of each chapter. Chapters 15 and 16 are also peculiar; I started writing chapter 15 when I first began work on the book, then didn’t touch it for months, and then renumbered it as chapter 16 before actually finishing it.
This data is indicative of Emily’s and my writing style—we would each pick a chapter and work on them simultaneously until they were done, then edit the other person’s work, add the interview, then call the chapter basically done and move on. In theory you could have a single author write multiple chapters and bounce between them as they feel like it, but to me that seems really hard to do. By quickly powering through a chapter you have the highest chance of it having a consistent, interesting narrative.
When the writing was done
For fun, I was interested in comparing when I would do my writing to when Emily would. While Emily made overall more commits than me since she would make smaller amounts of changes for each commit, that shouldn’t affect any patterns of when they were done. Here is a box plot showing when we made our commits, adjusted for the fact that we worked in different time zones and split by weekday and weekend:
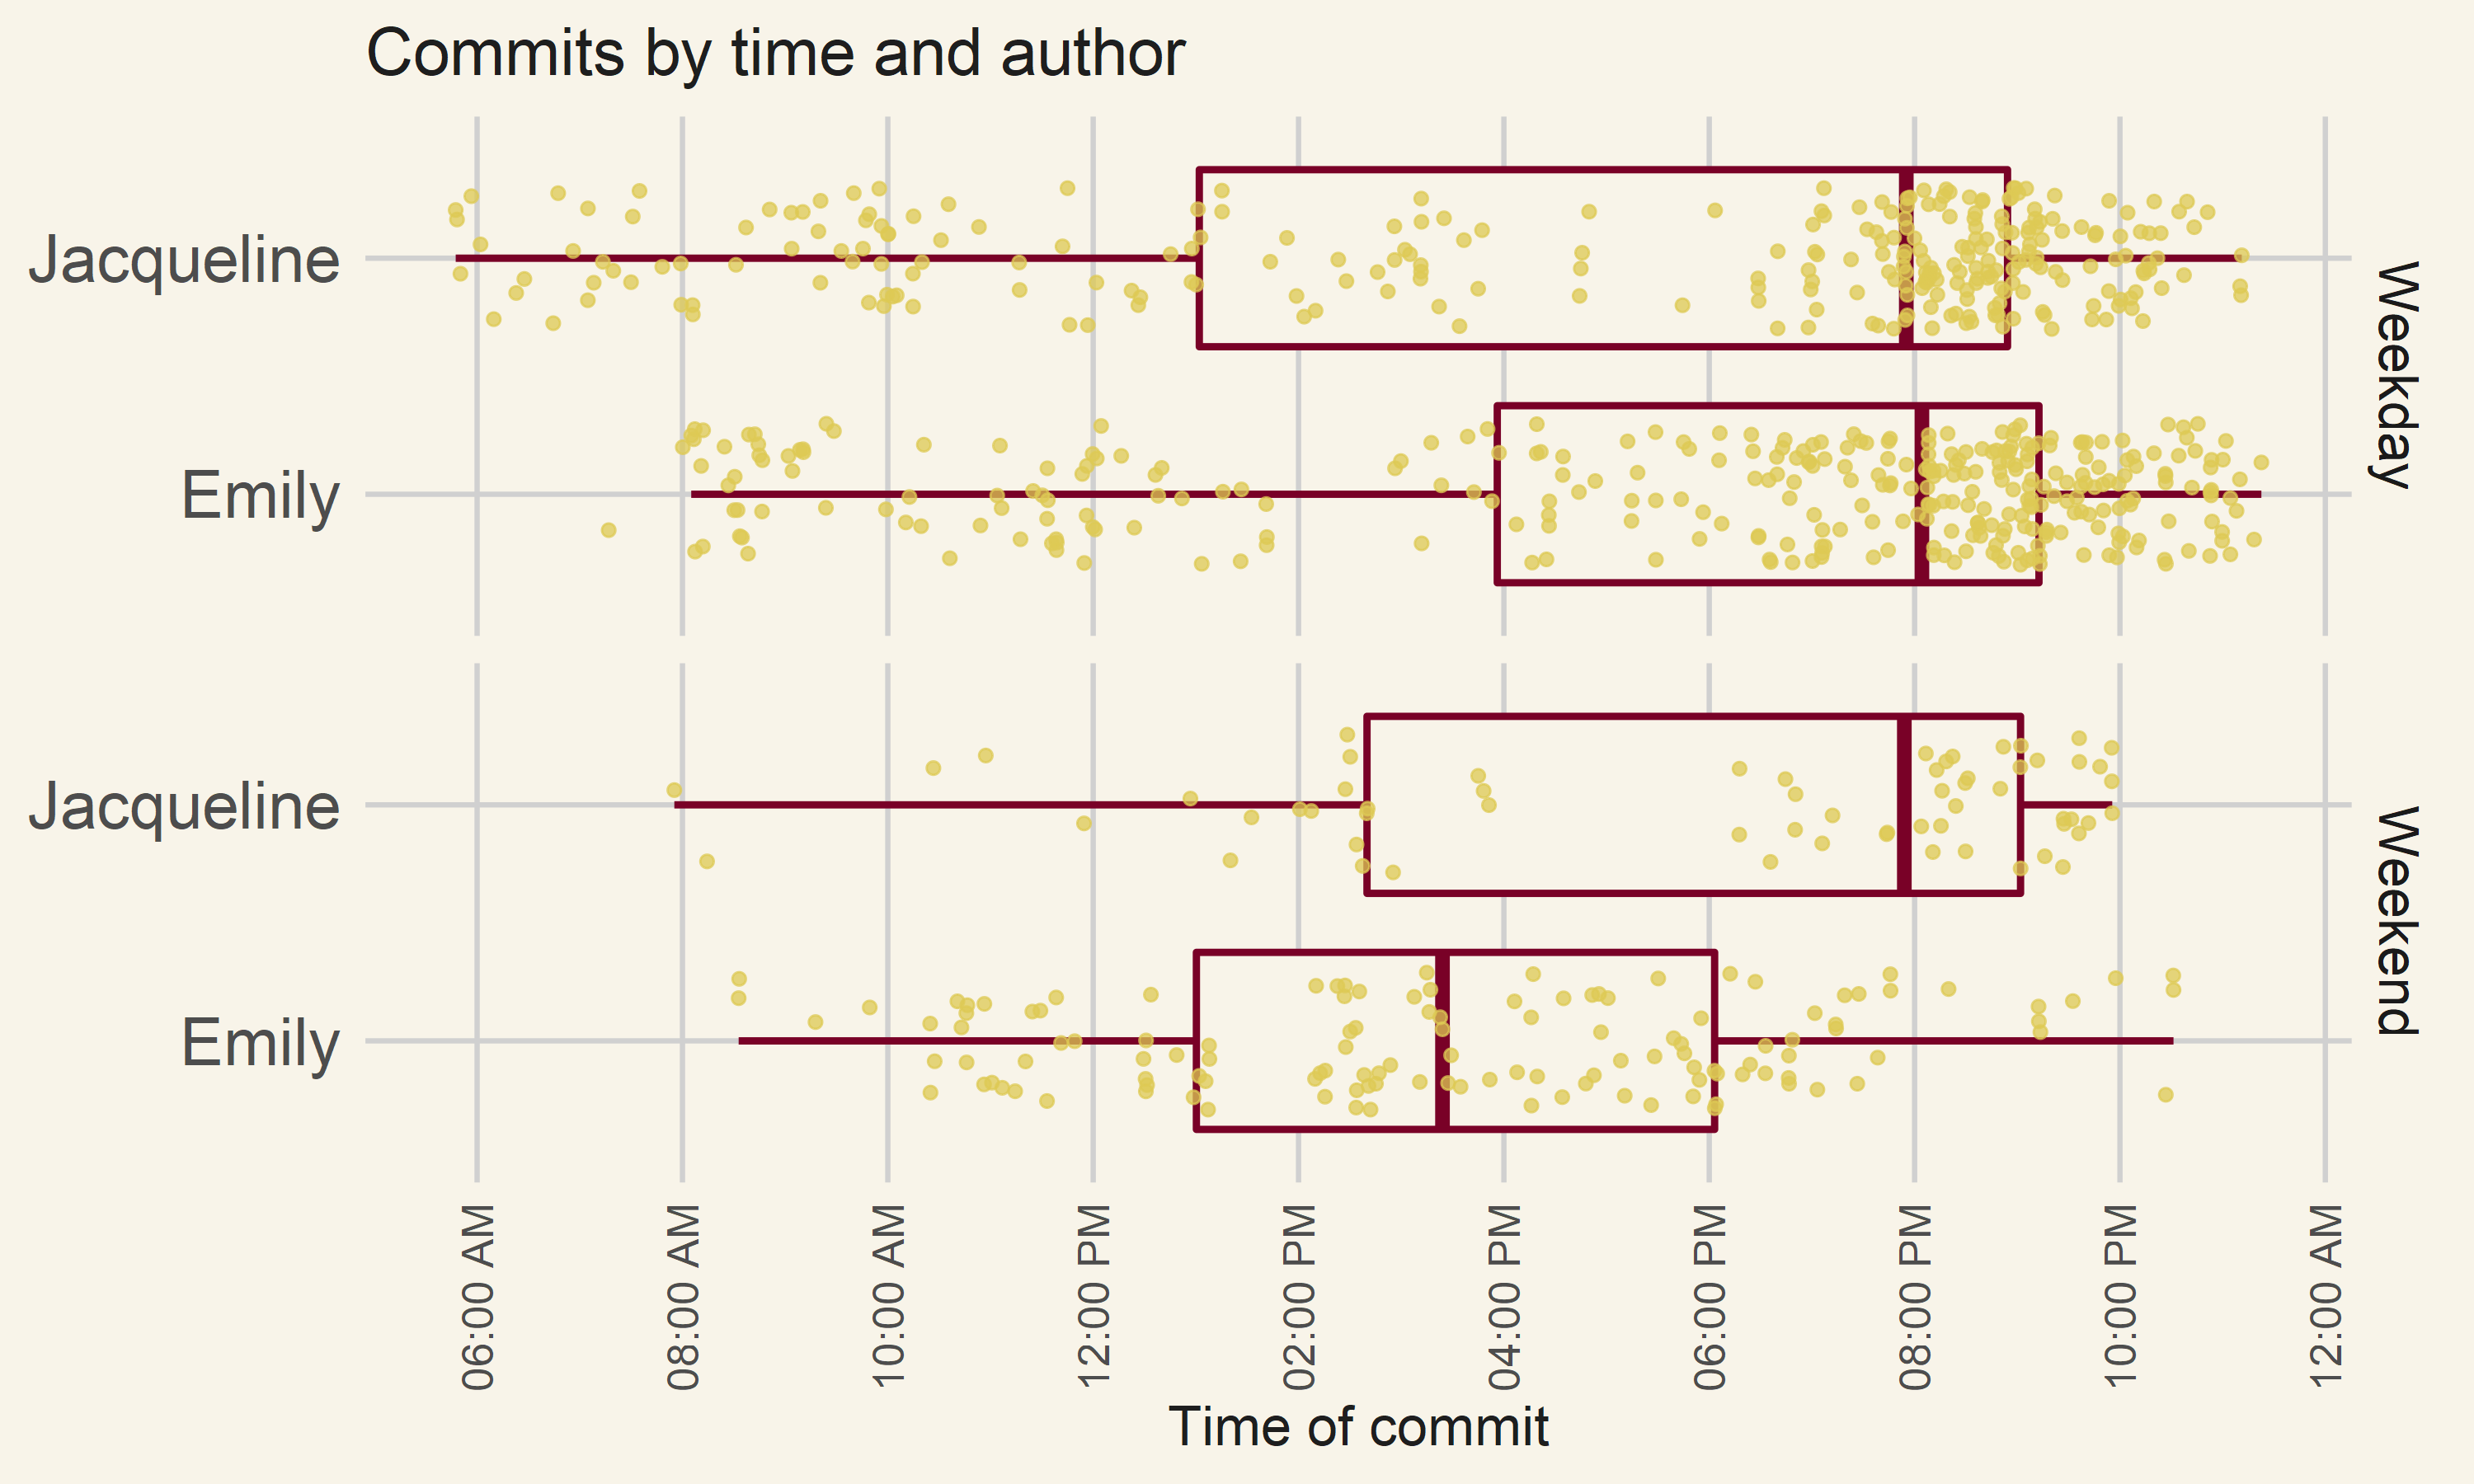 Me and Emily’s commits to our repository by time
There are a few interesting things here. First, for both me and Emily on weekdays half of our writing was done after 8pm and less than 25% was done before 2pm. It makes sense that we don’t do very much work before 2pm, because we both had day jobs besides “spend a year writing a book.” Emily is a little bit more of a night owl then me, since she committed after 10pm almost 50% more than me. On weekends Emily tends to work in the morning and afternoon whereas I work in the evening.
Within this data are two differences between us that happen to be connected. First, I tend to write more in the very early morning then Emily—she has a single commit before 8am whereas I have plenty between 6 and 8am. I also have a huge gap in my commits between 4 and 7pm and Emily doesn’t. Both of these are because my family, unlike hers, includes a toddler. Raising a human child places a burden on me and my wife—some of the only times I got that were distraction free were before 7am. Between 4 and 7pm my wife Heather and I were both back from work making dinner and spending time with our child. Our child’s bedtime is, not coincidentally, 7pm. Because I have a loving and supportive wife who could stay at home after our baby was asleep I was able to go out to coffee shops after dinner a couples times of week to work on the book, and hence why I have so many commits then on both weekdays and weekends.
Wrapping it up
I wanted to do more of an analysis on the book, but this part took so much time I didn’t have the time to do so. As discussed in the book it’s better to share what you have then spend too long iterating and never finishing. There are still a lot more ways for me to look at the data on the book—in addition to the git commits I could analyze the actual text, or I could even look at my coffee shop transactions to see how much I’ve indirectly spent on writing the book (it’s a lot). Maybe if I’m lucky my coauthor will take on some of this…
Normally, at the end of a blog post about a data project like this our book recommends linking to the code on GitHub and the data to try it out yourself. Unfortunately this data isn’t publicly available so this code wouldn’t be meaningful. That said, you could try doing a similar analysis on any git repository changing over time!
Hopefully this inspired you to think about what data projects of your own you have in your life to help grow your career, or at least has inspired you to go to bestbook.cool and grab a copy of the book!